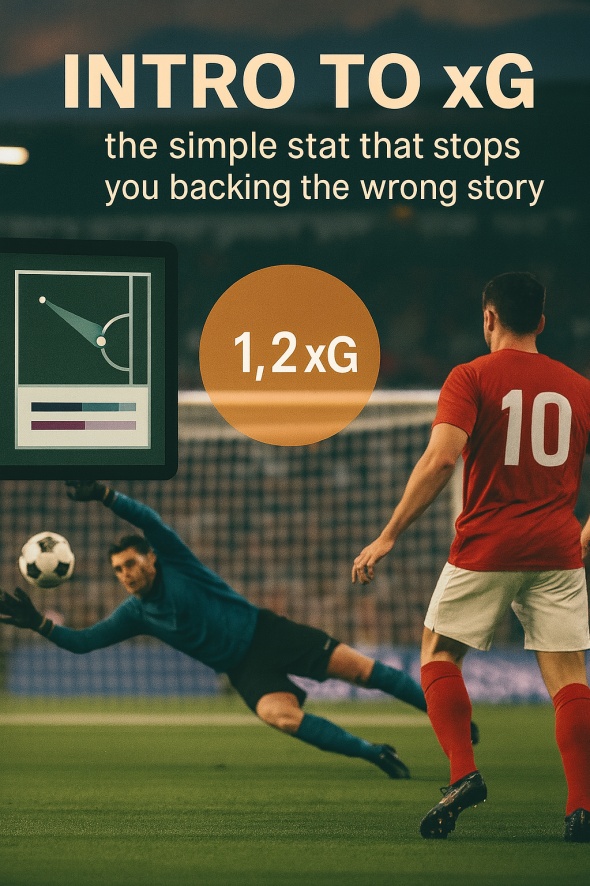
Intro to xG: the simple stat that stops you backing the wrong story
If you’ve ever watched the highlights, felt certain your side were “all over them”, and still lost your bet, you were following the story, not the chances. Expected Goals (xG) shows you the match underneath the scoreline by scoring the quality of every shot.
Highlights tell you what happened. xG tells you how repeatable it was.
What xG actually means (kept simple)
- Every shot gets a score between 0 and 1 showing how likely it was to be a goal.
- Two-yard tap-in: high (around 0.7).
- Tight angle or 30-yard swing: low (around 0.03–0.10).
- Add up a team’s shot scores for the match: that total is their xG.
- Add up the opponents’ shot scores: that’s xGA (xG against).
- Look across several fixtures (not one) to judge performance rather than being fooled by a flattering or harsh result.
- Different websites model shots slightly differently, so stick to one source and watch the trend, not a single game.
Example:
Team A shots: 0.35 + 0.25 + 0.09 + 0.05 = 0.74 xG
Team B shots: 0.62 = 0.62 xG
Even if Team B nicked a 0–1, the chance quality in the match was close. The score alone can mislead.
Going deeper: xGOT (Expected Goals on Target)
xG only looks at the chance before the ball is struck. Expected Goals on Target (xGOT) adds another layer by measuring the quality of the shot once it’s been hit. A tame finish straight at the keeper will carry less xGOT than a strike arrowing into the top corner from the same position. In simple terms:
- xG = how good the chance was before the shot.
- xGOT = how good the shot was once taken.
This helps separate teams (or players) who create strong chances but waste them, from those who consistently test keepers with high-quality efforts. Used together, xG and xGOT show both the supply of chances and the finishing applied to them. For beginners, start with xG; once you’re comfortable, add xGOT to see the fuller picture.
Why xG beats gut feel
- Process over results. Scores jump about from deflections, keepers in inspired form, and one-off worldies. xG focuses you on repeatable chance creation.
- Samples, not snapshots. One match is noisy. A rolling look over the last 5–10 fixtures gives you a steadier read.
- Context matters. Opponent strength, venue (home/away), and game state (leading, level, chasing) change how teams play. Compare like with like.
A two-minute xG routine
Run this the same way before you get involved:
- Rolling xG form – Over the last 5–10, do they consistently create more chance quality than they concede (positive xG minus xGA)?
- Who and where – Was that built mostly at home or against weak opposition? Adjust when the venue or fixture list toughens.
- Results vs process – If results are glossy but xG is flat or negative, that shine fades. If results look poor but xG is strong, improvement is likely.
This simple routine stops you backing teams on vibes and match reports.
What xG can—and can’t—do
- Excellent for spotting unsustainable runs. Finishing and goalkeeping swing above and below xG in short bursts, then cool towards normal. Treat extreme over- or under-performance as temporary unless it persists over a large sample.
- Not perfect. Single-match xG is volatile; some feeds under-capture set-pieces or fast transitions. Keep conclusions modest, samples sensible, and be consistent with your data source.
Where xG points to opportunity (without the heavy maths)
- Match odds/handicap (sides): a sustained positive xG differential (xG for minus xGA) is a better guide to true team strength than a handful of narrow wins or losses. Markets often underrate sides whose process is solid but recent results lag.
- Totals (goals): look at xG pace—the combined chance quality in recent fixtures—to judge likely scoring environments more reliably than raw goals alone.
Turning those reads into probabilities and then fair prices, applying a buffer, and only acting when the edge clears that buffer is the professional bit. We teach that step-by-step inside our system; this blog is your on-ramp, not the full map.
Common pitfalls to avoid
- Tiny samples. Three fixtures can make anyone look elite or broken. Always note the sample size.
- Knee-jerk reactions. Media narratives are selective. Anchor your view on xG/xGA and context.
- Provider hopping. Different models, different values. Pick one reliable feed and stick with it.
- Overreacting to keepers/finishers. Don’t treat short bursts above/below xG as permanent unless there’s long-term evidence.
Key takeaways
- xG measures chance quality, so you judge performance—not just scores.
- xGOT builds on this by showing how well chances were actually struck.
- Samples and context matter; use rolling windows and opponent/venue filters.
- Use these tools to spot gaps between results and reality; act with discipline, not hunches.
We teach all of this—properly and in sequence—inside our Professional Training Membership, including how to convert xG and xGOT reads into fair odds with buffers and a weekly routine you can actually run. If you want selections only, our Beginner and VIP plans are available; if you want the system, go Professional.
Download Turn the Tide: 8 Fast Fixes That Shift the Odds in Your Favour.
Sign up now for the Professional Training Membership to master the complete, step-by-step method behind this blog.
Discover More about EdgeVerge
Join EdgeVerge today and experience the difference that professional sports analysis and insights can offer, or download the Turn the Tide 10 Step Guide to learn more.


